|
|||||||||||||||||||||||||||||||||||||||||||||||||||||||||||||||||||||||||||||||||||||||||||||||||||||||||||||||||||||||||||||||||||||||||||||||||||||||||||||||||||||||||||||||||||||||||||||||||||||||||||||||||||||||||||||||||||||||||||||||||||||||||||||||||||||||||||||||||||||||||||||||||||||||||||||||||||||||||||||||||||||||||||||||||||||||||||||||||||||||||||||||||||||||||||||||||||||||||||||||||||||||||||||
 Featured MNV Articles:
| Thursday Sector Laggards: Energy, MaterialsBy Metals Channel Staff, Thursday, June 17, 2:37 PM ET
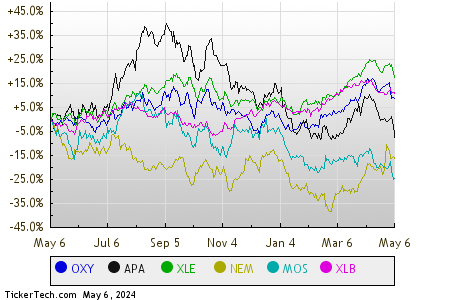
In afternoon trading on Thursday, Energy stocks are the worst performing sector, showing a 4.1% loss. Within that group, Occidental Petroleum Corp (NYSE:OXY) and APA Corp (NASDAQ:APA) are two of the day's laggards, showing a loss of 7.1% and 6.7%, respectively. Among energy ETFs, one ETF following the sector is the Energy Select Sector SPDR ETF (NYSE:XLE), which is down 3.3% on the day, and up 43.96% year-to-date. Occidental Petroleum Corp, meanwhile, is up 64.07% year-to-date, and APA Corp is up 48.70% year-to-date. Combined, OXY and APA make up approximately 3.6% of the underlying holdings of XLE. The next worst performing sector is the Materials sector, showing a 2.6% loss. Among large Materials stocks, Newmont Corp (NYSE:NEM) and Mosaic Co (NYSE:MOS) are the most notable, showing a loss of 6.5% and 6.2%, respectively. One ETF closely tracking Materials stocks is the Materials Select Sector SPDR ETF (XLB), which is down 2.4% in midday trading, and up 13.66% on a year-to-date basis. Newmont Corp, meanwhile, is up 8.64% year-to-date, and Mosaic Co is up 33.57% year-to-date. Combined, NEM and MOS make up approximately 5.9% of the underlying holdings of XLB. Comparing these stocks and ETFs on a trailing twelve month basis, below is a relative stock price performance chart, with each of the symbols shown in a different color as labeled in the legend at the bottom:
Here's a snapshot of how the S&P 500 components within the various sectors are faring in afternoon trading on Thursday. As you can see, three sectors are up on the day, while six sectors are down.
This Article's Word Cloud:
Among
Change
Combined
Communications
Comparing
Consumer
Corp
Dividend
ETFs
Energy
Financial
Giants
Healthcare
Held
Here
Industrial
Materials
Mosaic
NYSE
Newmont
Occidental
Petroleum
Products
SPDR
Sector
Select
Services
Start
Technology
Thursday
afternoon
approximately
basis
date
down
holdings
loss
make
meanwhile
performing
respectively
sector
sectors
showing
stocks
trading
underlying
which
worst
year
|